Tidy-transcriptomics manifesto
## ── Attaching packages ─────────────────────────────────────── tidyverse 1.3.1 ──## ✓ ggplot2 3.3.5 ✓ purrr 0.3.4
## ✓ tibble 3.1.2 ✓ dplyr 1.0.7
## ✓ tidyr 1.1.3 ✓ stringr 1.4.0
## ✓ readr 1.4.0 ✓ forcats 0.5.1## ── Conflicts ────────────────────────────────────────── tidyverse_conflicts() ──
## x dplyr::filter() masks stats::filter()
## x dplyr::lag() masks stats::lag()![]()
In this first post, we want to introduce the concept of tidy transcriptomics and its principles is moved by.
What is tidy transcriptomics
Tidy transcriptomics is a specific approach to transcriptomic data analysis in R, that uses the “tidy” principles proposed by Wickham et al.. Tidy transcriptomics introduces both a tidy data representation and manipulation (for single-cell and bulk) with the packages tidySummarizedExperiment, tidySingleCellExperiment, and tidyseurat and a tidy analysis workflow (for bulk data) with the package tidybulk.
The tidy transcriptomics manifesto
This manifesto lays down the principles of tidy transcriptomics that tidybulk and tidySummarizedExperiment, tidySingleCellExperiment, and tidyseurat are based on. These principles are in line with the tidy tools manifesto.
- Use easy-to-understand, verbose, jargon- and acronym-free vocabulary. If the English dictionary is not enough to understand the underlying meaning of a function or a variable name, it is a bad sign. _https://iubmb.onlinelibrary.wiley.com/doi/10.1002/bmb.20922_; and the cost of saving a few characters may be bigger than we think.
- Present/visualise information in its raw form when possible. Modern visualisation tools (e.g. ggplot2) allow the use of custom scales to visualise data. For example, for visualising p-values apply the
log10_reversescale instead of transforming the p-values in their negative-log form; for visualising (raw, scaled and/or adjusted) transcript abundance (in the form of read counts) use thelog1pscale instead of transforming the data in its log (or log count-per-million) form. - Avoid the creation of temporary variables when possible. When working interactively, creating variables to store data is a bug-prone process, especially if multiple assignments are done on the same variable through the workflow. The main utility of variables should be to store data that is used more than once. Tidyverse allows complex operations to be combined in a simple way, reducing the need to create temporary variables.
Integration map
All packages are under active development, and are in a maturing lifecycle.
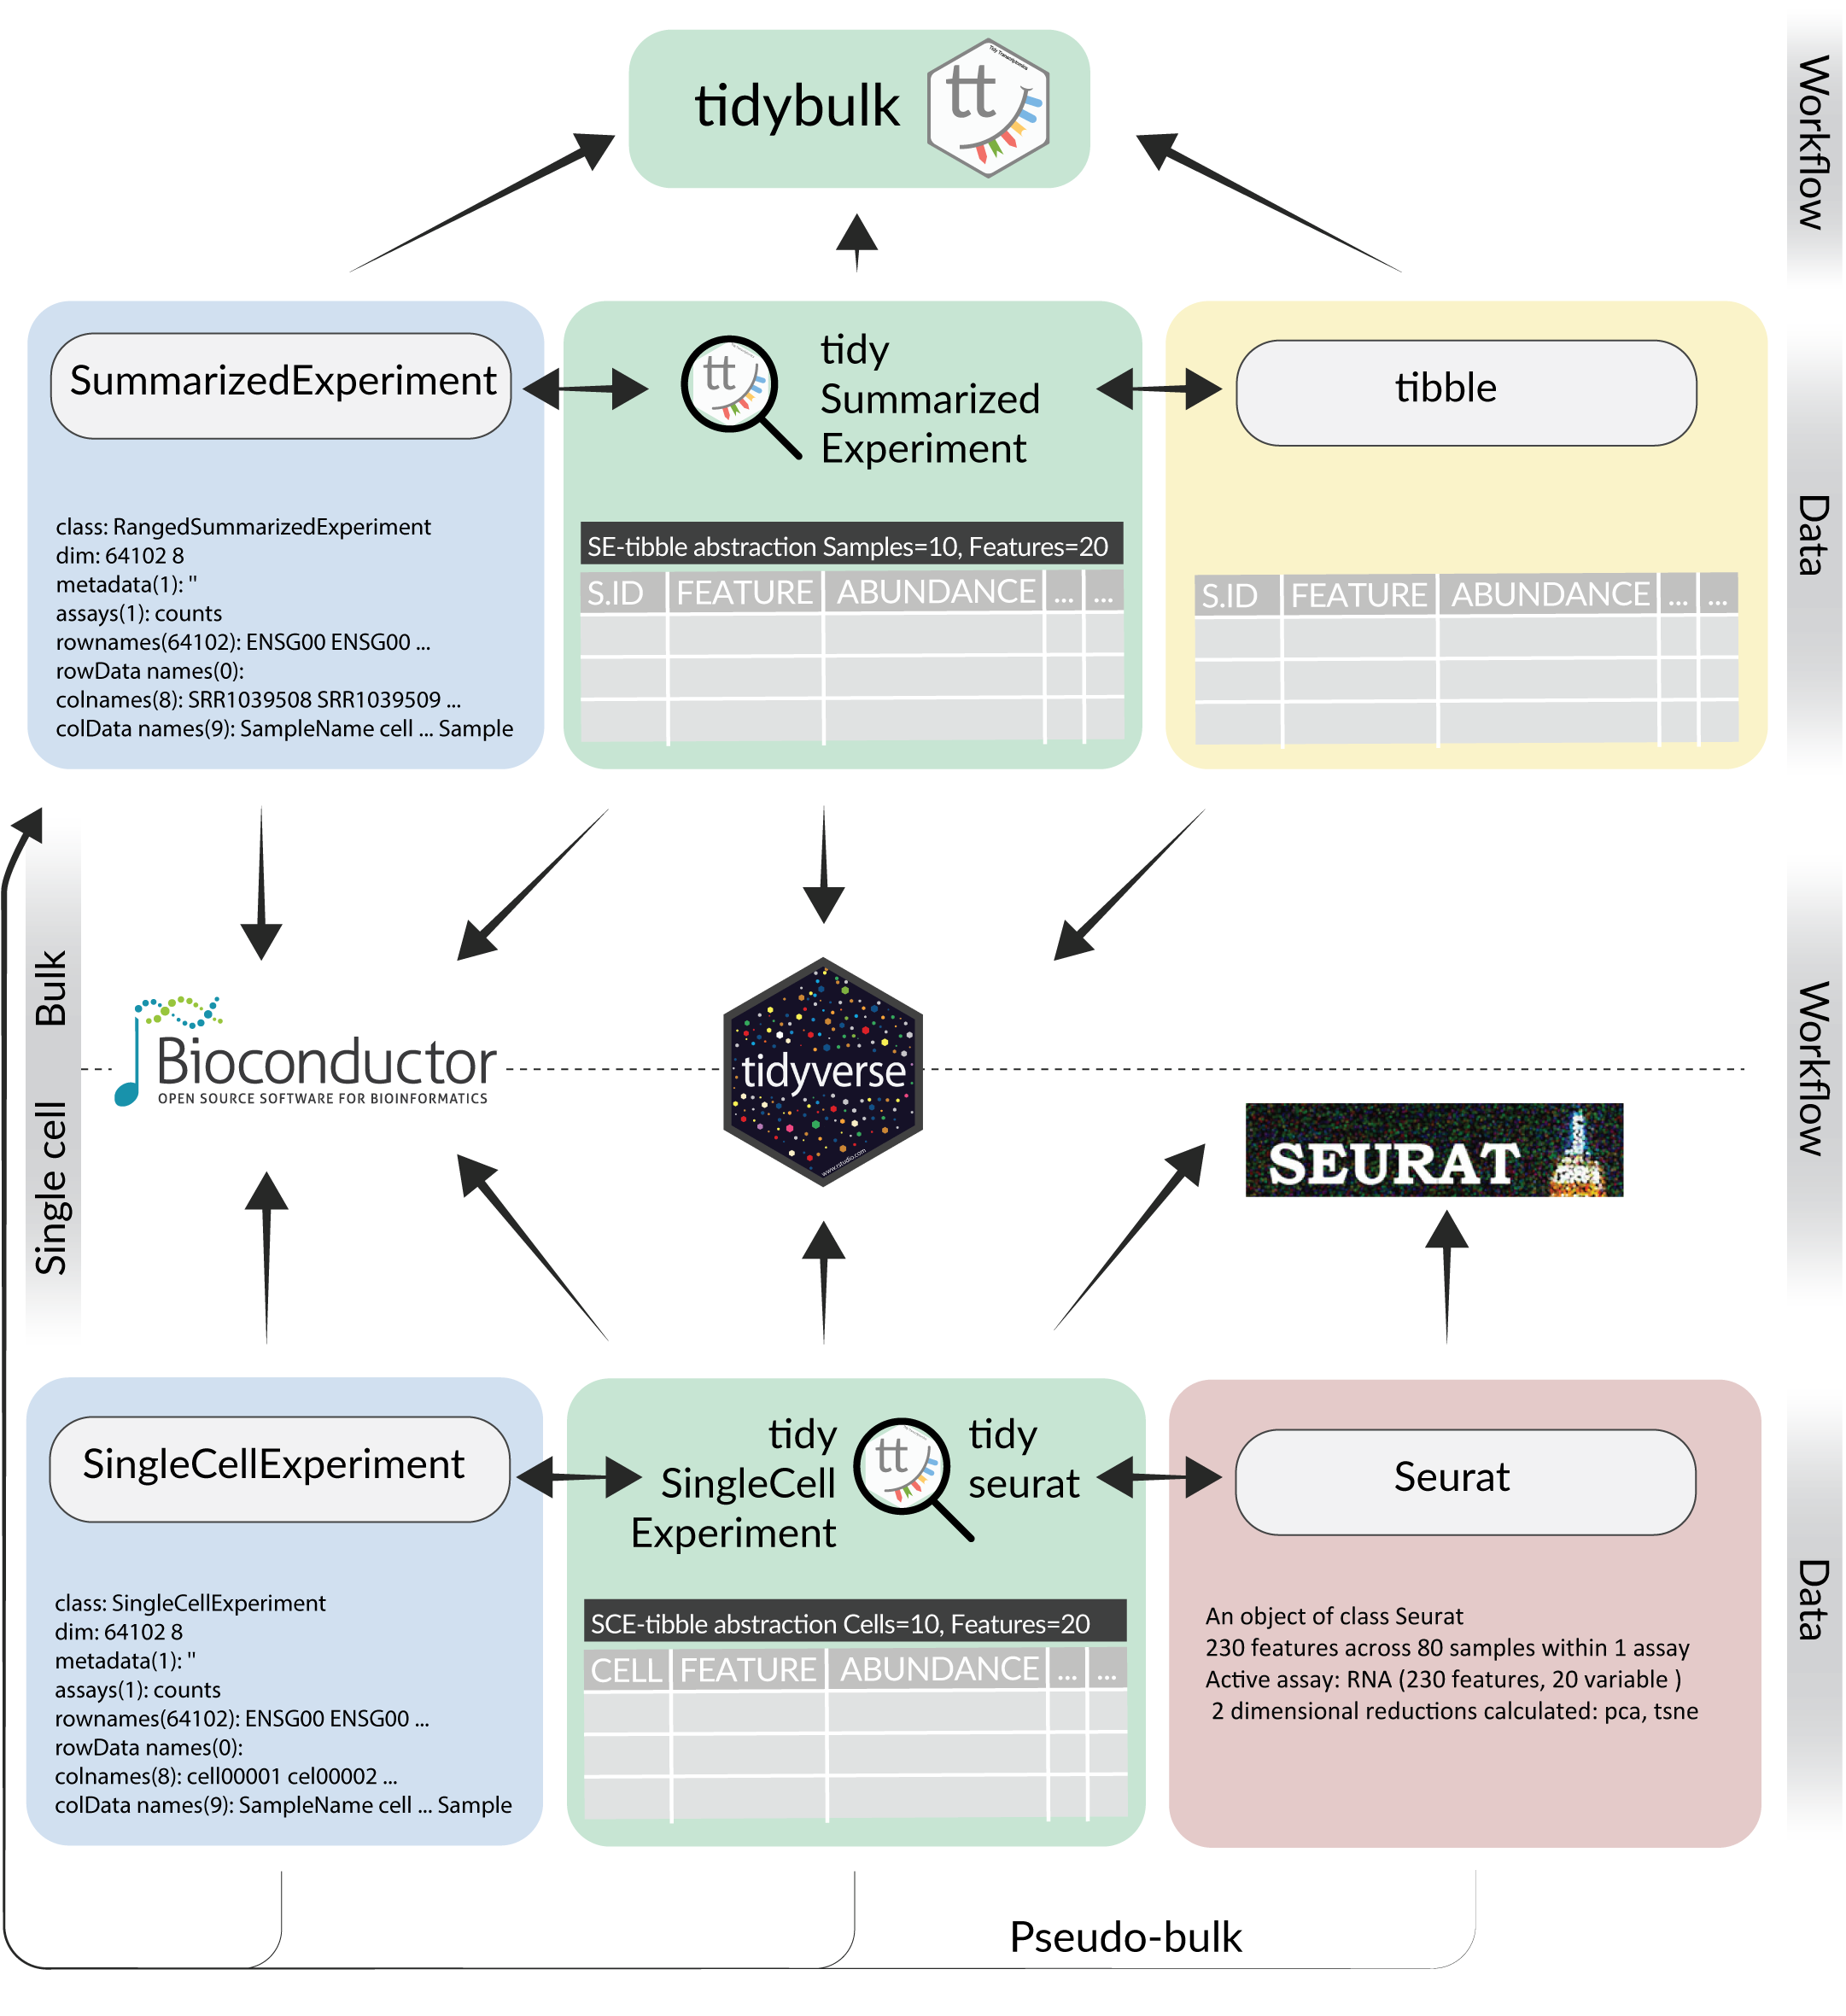
There are two parts in the tidy transcriptomics ecosystem: data and analysis framework. So far, for bulk RNA sequencing both data (tidySummarizedExperiment) and analysis (tidybulk) frameworks are available. In contrast,for single cell only data frameworks are available (tidySingleCellExperiment and tidyseurat).
What data frameworks are and what they are not
Data frameworks are not data containers. Data frameworks are data-abstraction that display and manipulate your existing containers (i.e. SummarizedExperiment, SingleCellExperiment and Seurat object) in a tidy manner. Therefore there is not such a thing as tidy* object. This has the advantage of allowing you to use tidyverse on transcriptomics data without compromising your existing pipelines. That is, if a method works for SummarizedExperiment it works for its tidy representation.
Therefore, the question “can we go from tidySummarizedExperiment to SummarizedExperiment and viceversa” is not relevant, as we never leave SummarizedExperiment in the first place.
Giving a consistent interface despite different data containers
With tidy transcriptomics, we differentiate the data container from the user interface. As an analogy, if we want to see picture of cats, we don’t care that a Unix and Windows machines store information in the hard drive differently. Similarly, if we want to display, manipulate and visualise transcriptomic data, we might not care how the data is stored.
Which analysis framework can interface with which data framework
Bulk RNA sequencing data
SummarizedExperimentcan interface withBioconductorandtidybulktibblecan interface with tidyverse andtidybulktidySummarizedExperimentcan interface with all three:Bioconductor, tidyverse andtidybulk
Single-cell RNA sequencing data
SingleCellExperimentcan interface withBioconductortidySingleCellExperimentcan interface withBioconductorandtidyverseSeuratobject can interface withSeurattidyseuratobject can interface withSeuratandtidyverse
Differences between tidy and base transcriptomics sinthax
Here we provide few examples of the differences in programming transcriptomics analyses with tidy transcriptomics and the base R alternative. An important aspect is that tidy transcriptomics is complementary with standard workflows. Everything that works with SummarizedExperiment, SingleCellExperiment and Seurat works with their tidy representations.
Tidybulk and tidySummarizedExperiment
This example is taken from the workshop (BioC2021)[https://stemangiola.github.io/bioc2021_tidyomics/tidyomicsBlog/articles/tidyomics/tidyomicsBlog.html].
As tidybulk smoothly integrates with ggplot2 and other tidyverse packages it can save on typing and make plots easier to generate. Compare the code for creating density plots with tidybulk versus standard base R below (standard code adapted from (Law et al. 2016)).
tidybulk
# tidybulk
airway %>%
  keep_abundant(factor_of_interest = dex) %>%
  scale_abundance() %>%
  pivot_longer(cols = c("counts", "counts_scaled"), names_to = "source", values_to = "abundance") %>%
  ggplot(aes(x = abundance + 1, color = sample)) +
  geom_density() +
  facet_wrap(~source) +
  scale_x_log10() +
  custom_theme
base R using edgeR
# Example code, no need to run
# Prepare data set
library(edgeR)
dgList <- SE2DGEList(airway)
group <- factor(dgList$samples$dex)
keep.exprs <- filterByExpr(dgList, group = group)
dgList <- dgList[keep.exprs, , keep.lib.sizes = FALSE]
nsamples <- ncol(dgList)
logcounts <- log2(dgList$counts)
# Setup graphics
col <- RColorBrewer::brewer.pal(nsamples, "Paired")
par(mfrow = c(1, 2))
# Plot raw counts
plot(density(logcounts[, 1]), col = col[1], lwd = 2, ylim = c(0, 0.26), las = 2, main = "", xlab = "")
title(main = "Counts")
for (i in 2:nsamples) {
  den <- density(logcounts[, i])
  lines(den$x, den$y, col = col[i], lwd = 2)
}
legend("topright", legend = dgList$samples$Run, text.col = col, bty = "n")
# Plot scaled counts
dgList_norm <- calcNormFactors(dgList)
lcpm_n <- cpm(dgList_norm, log = TRUE)
plot(density(lcpm_n[, 1]), col = col[1], lwd = 2, ylim = c(0, 0.26), las = 2, main = "", xlab = "")
title("Counts scaled")
for (i in 2:nsamples) {
  den <- density(lcpm_n[, i])
  lines(den$x, den$y, col = col[i], lwd = 2)
}
legend("topright", legend = dgList_norm$samples$Run, text.col = col, bty = "n")
SingleCellExperiment and tidySingleCellExperiment
These examples are taken from the article (Interfacing Seurat with the R tidy universe)[https://academic.oup.com/bioinformatics/advance-article/doi/10.1093/bioinformatics/btab404/6283576].
Calculating a transcriptional signature.
Base
# Load data
pbmc_SCE = tidySingleCellExperiment::pbmc_small

signature_score_1 =
  pbmc_SCE[c("CD79A", "CD79B"),] %>%
  logcounts() %>%
  colSums() %>%
  scales::rescale(to = c(0,1))

signature_score_2 =
  pbmc_SCE[c("CD3D", "CCR7"),] %>%
  logcounts() %>%
  colSums() %>%
  scales::rescale(to = c(0,1))

signature_score_1 - signature_score_2
## ATGCCAGAACGACT CATGGCCTGTGCAT GAACCTGATGAACC TGACTGGATTCTCA AGTCAGACTGCACA
## -0.1282987 -1.0000000 -0.4892647 -0.4769175 -0.8142420
## TCTGATACACGTGT TGGTATCTAAACAG GCAGCTCTGTTTCT GATATAACACGCAT AATGTTGACAGTCA
## -0.5065754 -0.8943038 -0.8433443 -0.4750597 -0.4399134
## AGGTCATGAGTGTC AGAGATGATCTCGC GGGTAACTCTAGTG CATGAGACACGGGA TACGCCACTCCGAA
## 0.4399898 0.8313740 0.8367149 0.9404373 0.8785365
## CTAAACCTGTGCAT GTAAGCACTCATTC TTGGTACTGAATCC CATCATACGGAGCA TACATCACGCTAAC
## 0.8647225 0.7631773 0.8315032 0.9127912 0.6386232
## TTACCATGAATCGC ATAGGAGAAACAGA GCGCACGACTTTAC ACTCGCACGAAAGT ATTACCTGCCTTAT
## 0.0000000 0.0000000 0.2946328 0.0000000 -0.2487348
## CCCAACTGCAATCG AAATTCGAATCACG CCATCCGATTCGCC TCCACTCTGAGCTT CATCAGGATGCACA
## 0.0000000 0.0000000 0.2908813 0.0000000 0.2572103
## CTAAACCTCTGACA GATAGAGAAGGGTG CTAACGGAACCGAT AGATATACCCGTAA TACTCTGAATCGAC
## 0.2839127 -0.5116071 0.3556147 0.0000000 0.0000000
## GCGCATCTTGCTCC GTTGACGATATCGG ACAGGTACTGGTGT GGCATATGCTTATC CATTACACCAACTG
## 0.0000000 -0.3058682 0.0000000 -0.3499484 0.0000000
## TAGGGACTGAACTC GCTCCATGAGAAGT TACAATGATGCTAG CTTCATGACCGAAT CTGCCAACAGGAGC
## 0.0000000 -0.3969658 -0.4491779 0.0000000 -0.4252278
## TTGCATTGAGCTAC AAGCAAGAGCTTAG CGGCACGAACTCAG GGTGGAGATTACTC GGCCGATGTACTCT
## -0.5803536 -0.3499484 -0.4602168 -0.4537220 -0.4789804
## CGTAGCCTGTATGC TGAGCTGAATGCTG CCTATAACGAGACG ATAAGTTGGTACGT AAGCGACTTTGACG
## 0.2535563 0.0000000 0.3265729 0.3521070 0.2917172
## ACCAGTGAATACCG ATTGCACTTGCTTT CTAGGTGATGGTTG GCACTAGACCTTTA CATGCGCTAGTCAC
## 0.2962249 0.0000000 0.0000000 0.3533870 0.0000000
## TTGAGGACTACGCA ATACCACTCTAAGC CATATAGACTAAGC TTTAGCTGTACTCT GACATTCTCCACCT
## 0.0000000 0.0000000 0.0000000 0.7333251 0.1920881
## ACGTGATGCCATGA ATTGTAGATTCCCG GATAGAGATCACGA AATGCGTGGACGGA GCGTAAACACGGTT
## 0.0000000 0.0000000 0.0000000 0.2500814 -0.2120188
## ATTCAGCTCATTGG GGCATATGGGGAGT ATCATCTGACACCA GTCATACTTCGCCT TTACGTACGTTCAG
## 0.0000000 0.0000000 0.0000000 0.0000000 0.0000000
## GAGTTGTGGTAGCT GACGCTCTCTCTCG AGTCTTACTTCGGA GGAACACTTCAGAC CTTGATTGATCTTC
## 0.0000000 0.0000000 0.0000000 0.0000000 0.0000000tidySingleCellExperiment
# Load data
pbmc_SCE = tidySingleCellExperiment::pbmc_small

pbmc_SCE %>%
  join_features(c("CD79A", "CD79B", "CD3D", "CCR7"), assay = "logcounts", shape = "wide") %>%
  mutate(signature_score =
           scales::rescale(CD79A + CD79B, to = c(0,1)) -
           scales::rescale(CD3D + CCR7, to = c(0,1))
  ) %>%
  select(signature_score, everything())
## # A SingleCellExperiment-tibble abstraction: 80 x 22
## cell signature_score orig.ident nCount_RNA nFeature_RNA RNA_snn_res.0.8
## <chr> <dbl> <fct> <dbl> <int> <fct>
## 1 ATGC… -0.128 SeuratPro… 70 47 0
## 2 CATG… -1 SeuratPro… 85 52 0
## 3 GAAC… -0.489 SeuratPro… 87 50 1
## 4 TGAC… -0.477 SeuratPro… 127 56 0
## 5 AGTC… -0.814 SeuratPro… 173 53 0
## 6 TCTG… -0.507 SeuratPro… 70 48 0
## 7 TGGT… -0.894 SeuratPro… 64 36 0
## 8 GCAG… -0.843 SeuratPro… 72 45 0
## 9 GATA… -0.475 SeuratPro… 52 36 0
## 10 AATG… -0.440 SeuratPro… 100 41 0
## # … with 70 more rows, and 16 more variables: letter.idents <fct>,
## # groups <chr>, RNA_snn_res.1 <fct>, file <chr>, ident <fct>, CD79A <dbl>,
## # CD79B <dbl>, CD3D <dbl>, CCR7 <dbl>, PC_1 <dbl>, PC_2 <dbl>, PC_3 <dbl>,
## # PC_4 <dbl>, PC_5 <dbl>, tSNE_1 <dbl>, tSNE_2 <dbl>Cell subsampling for mulisample balanced UMAP representation
Base
splits =
  colnames(pbmc_SCE) %>%
  split(pbmc_SCE$file  )

min_size = splits %>%
  sapply(length) %>% min()

cell_subset = splits %>%
  lapply(function(x) sample(x, min_size)) %>%
  unlist()

pbmc_SCE[, cell_subset]
## # A SingleCellExperiment-tibble abstraction: 72 x 17
## cell orig.ident nCount_RNA nFeature_RNA RNA_snn_res.0.8 letter.idents groups
## <chr> <fct> <dbl> <int> <fct> <fct> <chr>
## 1 ATTA… SeuratPro… 463 77 1 B g1
## 2 CTAA… SeuratPro… 246 59 0 A g1
## 3 TAGG… SeuratPro… 156 60 0 A g1
## 4 ATAG… SeuratPro… 406 74 1 B g1
## 5 AATG… SeuratPro… 100 41 0 A g1
## 6 GGCA… SeuratPro… 172 29 0 A g1
## 7 TACT… SeuratPro… 156 48 0 A g1
## 8 CTTG… SeuratPro… 233 76 1 B g1
## 9 GATA… SeuratPro… 328 72 1 B g1
## 10 ACAG… SeuratPro… 151 59 0 A g1
## # … with 62 more rows, and 10 more variables: RNA_snn_res.1 <fct>, file <chr>,
## # ident <fct>, PC_1 <dbl>, PC_2 <dbl>, PC_3 <dbl>, PC_4 <dbl>, PC_5 <dbl>,
## # tSNE_1 <dbl>, tSNE_2 <dbl>tidySingleCellExperiment
pbmc_SCE %>%
  add_count(file  , name = "tot_cells") %>%
  mutate(min_cells = min(tot_cells)) %>%
  group_by(file  ) %>%
  sample_n(min_cells)
## Warning: The `.drop` argument of `add_count()` is deprecated as of dplyr 1.0.0.## tidySingleCellExperiment says: A data frame is returned for independent data analysis.## # A tibble: 72 x 33
## # Groups: file [2]
## cell orig.ident nCount_RNA nFeature_RNA RNA_snn_res.0.8 letter.idents groups
## <chr> <fct> <dbl> <int> <fct> <fct> <chr>
## 1 TTGA… SeuratPro… 787 88 0 A g1
## 2 CTAA… SeuratPro… 189 53 0 A g1
## 3 TGGT… SeuratPro… 64 36 0 A g1
## 4 ATTA… SeuratPro… 463 77 1 B g1
## 5 GGCA… SeuratPro… 172 29 0 A g1
## 6 TTGG… SeuratPro… 135 45 0 A g1
## 7 GCAG… SeuratPro… 72 45 0 A g1
## 8 CTGC… SeuratPro… 146 47 0 A g1
## 9 CTTG… SeuratPro… 233 76 1 B g1
## 10 ACCA… SeuratPro… 417 75 0 A g1
## # … with 62 more rows, and 26 more variables: RNA_snn_res.1 <fct>, file <chr>,
## # ident <fct>, tot_cells <int>, min_cells <int>, PC_1 <dbl>, PC_2 <dbl>,
## # PC_3 <dbl>, PC_4 <dbl>, PC_5 <dbl>, PC_6 <dbl>, PC_7 <dbl>, PC_8 <dbl>,
## # PC_9 <dbl>, PC_10 <dbl>, PC_11 <dbl>, PC_12 <dbl>, PC_13 <dbl>,
## # PC_14 <dbl>, PC_15 <dbl>, PC_16 <dbl>, PC_17 <dbl>, PC_18 <dbl>,
## # PC_19 <dbl>, tSNE_1 <dbl>, tSNE_2 <dbl>tidyseurat
Calculating a transcriptional signature.
Base
library(Seurat)## Registered S3 method overwritten by 'spatstat.geom':
## method from
## print.boxx cli## Attaching SeuratObject##
## Attaching package: 'Seurat'## The following object is masked from 'package:SummarizedExperiment':
##
## Assays# Load data
pbmc_Seurat = tidySingleCellExperiment::pbmc_small %>% as.Seurat() %>% NormalizeData()
signature_score_1 =
pbmc_Seurat[c("CD79A", "CD79B"),] %>%
Seurat::GetAssayData() %>%
colSums() %>%
scales::rescale(to = c(0,1))
signature_score_2 =
pbmc_Seurat[c("CD3D", "CCR7"),] %>%
Seurat::GetAssayData() %>%
colSums() %>%
scales::rescale(to = c(0,1))
signature_score_1 - signature_score_2## ATGCCAGAACGACT CATGGCCTGTGCAT GAACCTGATGAACC TGACTGGATTCTCA AGTCAGACTGCACA
## -0.1282987 -1.0000000 -0.4892647 -0.4769175 -0.8142420
## TCTGATACACGTGT TGGTATCTAAACAG GCAGCTCTGTTTCT GATATAACACGCAT AATGTTGACAGTCA
## -0.5065754 -0.8943038 -0.8433443 -0.4750597 -0.4399134
## AGGTCATGAGTGTC AGAGATGATCTCGC GGGTAACTCTAGTG CATGAGACACGGGA TACGCCACTCCGAA
## 0.4399898 0.8313740 0.8367149 0.9404373 0.8785365
## CTAAACCTGTGCAT GTAAGCACTCATTC TTGGTACTGAATCC CATCATACGGAGCA TACATCACGCTAAC
## 0.8647225 0.7631773 0.8315032 0.9127912 0.6386232
## TTACCATGAATCGC ATAGGAGAAACAGA GCGCACGACTTTAC ACTCGCACGAAAGT ATTACCTGCCTTAT
## 0.0000000 0.0000000 0.2946328 0.0000000 -0.2487348
## CCCAACTGCAATCG AAATTCGAATCACG CCATCCGATTCGCC TCCACTCTGAGCTT CATCAGGATGCACA
## 0.0000000 0.0000000 0.2908813 0.0000000 0.2572103
## CTAAACCTCTGACA GATAGAGAAGGGTG CTAACGGAACCGAT AGATATACCCGTAA TACTCTGAATCGAC
## 0.2839127 -0.5116071 0.3556147 0.0000000 0.0000000
## GCGCATCTTGCTCC GTTGACGATATCGG ACAGGTACTGGTGT GGCATATGCTTATC CATTACACCAACTG
## 0.0000000 -0.3058682 0.0000000 -0.3499484 0.0000000
## TAGGGACTGAACTC GCTCCATGAGAAGT TACAATGATGCTAG CTTCATGACCGAAT CTGCCAACAGGAGC
## 0.0000000 -0.3969658 -0.4491779 0.0000000 -0.4252278
## TTGCATTGAGCTAC AAGCAAGAGCTTAG CGGCACGAACTCAG GGTGGAGATTACTC GGCCGATGTACTCT
## -0.5803536 -0.3499484 -0.4602168 -0.4537220 -0.4789804
## CGTAGCCTGTATGC TGAGCTGAATGCTG CCTATAACGAGACG ATAAGTTGGTACGT AAGCGACTTTGACG
## 0.2535563 0.0000000 0.3265729 0.3521070 0.2917172
## ACCAGTGAATACCG ATTGCACTTGCTTT CTAGGTGATGGTTG GCACTAGACCTTTA CATGCGCTAGTCAC
## 0.2962249 0.0000000 0.0000000 0.3533870 0.0000000
## TTGAGGACTACGCA ATACCACTCTAAGC CATATAGACTAAGC TTTAGCTGTACTCT GACATTCTCCACCT
## 0.0000000 0.0000000 0.0000000 0.7333251 0.1920881
## ACGTGATGCCATGA ATTGTAGATTCCCG GATAGAGATCACGA AATGCGTGGACGGA GCGTAAACACGGTT
## 0.0000000 0.0000000 0.0000000 0.2500814 -0.2120188
## ATTCAGCTCATTGG GGCATATGGGGAGT ATCATCTGACACCA GTCATACTTCGCCT TTACGTACGTTCAG
## 0.0000000 0.0000000 0.0000000 0.0000000 0.0000000
## GAGTTGTGGTAGCT GACGCTCTCTCTCG AGTCTTACTTCGGA GGAACACTTCAGAC CTTGATTGATCTTC
## 0.0000000 0.0000000 0.0000000 0.0000000 0.0000000tidyseurat
It is the same as for tidySingleCellExperiment
library(tidyseurat)## ========================================
## tidyseurat version 0.2.3
## If you use TIDYSEURAT in published research, please cite:
##
## Mangiola et al. Interfacing Seurat with the R tidy universe. Bioinformatics 2021.
##
## This message can be suppressed by:
## suppressPackageStartupMessages(library(tidyseurat))
##
## To restore the Seurat default display use options("restore_Seurat_show" = TRUE)
## ========================================##
## Attaching package: 'tidyseurat'## The following object is masked from 'package:IRanges':
##
## slice## The following object is masked from 'package:S4Vectors':
##
## rename## The following object is masked from 'package:matrixStats':
##
## count## The following objects are masked from 'package:dplyr':
##
## add_count, bind_cols, bind_rows, count## The following object is masked from 'package:stats':
##
## filterpbmc_Seurat %>%
join_features(c("CD79A", "CD79B", "CD3D", "CCR7"), shape = "wide") %>%
mutate(signature_score =
scales::rescale(CD79A + CD79B, to = c(0,1)) -
scales::rescale(CD3D + CCR7, to = c(0,1))
) %>%
select(signature_score, everything())## # A Seurat-tibble abstraction: 80 x 24
## cell signature_score orig.ident nCount_original… nFeature_origin… nCount_RNA
## <chr> <dbl> <fct> <dbl> <int> <dbl>
## 1 ATGC… -0.128 SeuratPro… 70 47 70
## 2 CATG… -1 SeuratPro… 85 52 85
## 3 GAAC… -0.489 SeuratPro… 87 50 87
## 4 TGAC… -0.477 SeuratPro… 127 56 127
## 5 AGTC… -0.814 SeuratPro… 173 53 173
## 6 TCTG… -0.507 SeuratPro… 70 48 70
## 7 TGGT… -0.894 SeuratPro… 64 36 64
## 8 GCAG… -0.843 SeuratPro… 72 45 72
## 9 GATA… -0.475 SeuratPro… 52 36 52
## 10 AATG… -0.440 SeuratPro… 100 41 100
## # … with 70 more rows, and 18 more variables: nFeature_RNA <int>,
## # RNA_snn_res.0.8 <fct>, letter.idents <fct>, groups <chr>,
## # RNA_snn_res.1 <fct>, file <chr>, ident <fct>, CD79A <dbl>, CD79B <dbl>,
## # CD3D <dbl>, CCR7 <dbl>, PC_1 <dbl>, PC_2 <dbl>, PC_3 <dbl>, PC_4 <dbl>,
## # PC_5 <dbl>, tSNE_1 <dbl>, tSNE_2 <dbl>Cell subsampling for mulisample balanced UMAP representation
Base
splits =
  colnames(pbmc_Seurat) %>%
  split(pbmc_Seurat$file  )

min_size = splits %>%
  sapply(length) %>% min()

cell_subset = splits %>%
  lapply(function(x) sample(x, min_size)) %>%
  unlist()

pbmc_Seurat[, cell_subset]
## # A Seurat-tibble abstraction: 72 x 19
## cell orig.ident nCount_original… nFeature_origin… nCount_RNA nFeature_RNA
## <chr> <fct> <dbl> <int> <dbl> <int>
## 1 GCAG… SeuratPro… 72 45 72 45
## 2 GCGT… SeuratPro… 754 83 754 83
## 3 CATG… SeuratPro… 85 52 85 52
## 4 CATA… SeuratPro… 286 68 286 68
## 5 CTGC… SeuratPro… 146 47 146 47
## 6 CATC… SeuratPro… 353 80 353 80
## 7 TACT… SeuratPro… 156 48 156 48
## 8 ATAC… SeuratPro… 612 69 612 69
## 9 GGCA… SeuratPro… 126 53 126 53
## 10 GACA… SeuratPro… 872 96 872 96
## # … with 62 more rows, and 13 more variables: RNA_snn_res.0.8 <fct>,
## # letter.idents <fct>, groups <chr>, RNA_snn_res.1 <fct>, file <chr>,
## # ident <fct>, PC_1 <dbl>, PC_2 <dbl>, PC_3 <dbl>, PC_4 <dbl>, PC_5 <dbl>,
## # tSNE_1 <dbl>, tSNE_2 <dbl>tidyseurat
It is the same as for tidySingleCellExperiment
pbmc_Seurat %>%
  add_count(file  , name = "tot_cells") %>%
  mutate(min_cells = min(tot_cells)) %>%
  group_by(file  ) %>%
  sample_n(min_cells)
## tidyseurat says: A data frame is returned for independent data analysis.## # A tibble: 72 x 35
## # Groups: file [2]
## cell orig.ident nCount_original… nFeature_origin… nCount_RNA nFeature_RNA
## <chr> <fct> <dbl> <int> <dbl> <int>
## 1 GCAGCT… SeuratProj… 72 45 72 45
## 2 GCGTAA… SeuratProj… 754 83 754 83
## 3 CATGGC… SeuratProj… 85 52 85 52
## 4 CATATA… SeuratProj… 286 68 286 68
## 5 CTGCCA… SeuratProj… 146 47 146 47
## 6 CATCAG… SeuratProj… 353 80 353 80
## 7 TACTCT… SeuratProj… 156 48 156 48
## 8 ATACCA… SeuratProj… 612 69 612 69
## 9 GGCATA… SeuratProj… 126 53 126 53
## 10 GACATT… SeuratProj… 872 96 872 96
## # … with 62 more rows, and 29 more variables: RNA_snn_res.0.8 <fct>,
## # letter.idents <fct>, groups <chr>, RNA_snn_res.1 <fct>, file <chr>,
## # ident <fct>, tot_cells <int>, min_cells <int>, PC_1 <dbl>, PC_2 <dbl>,
## # PC_3 <dbl>, PC_4 <dbl>, PC_5 <dbl>, PC_6 <dbl>, PC_7 <dbl>, PC_8 <dbl>,
## # PC_9 <dbl>, PC_10 <dbl>, PC_11 <dbl>, PC_12 <dbl>, PC_13 <dbl>,
## # PC_14 <dbl>, PC_15 <dbl>, PC_16 <dbl>, PC_17 <dbl>, PC_18 <dbl>,
## # PC_19 <dbl>, tSNE_1 <dbl>, tSNE_2 <dbl>Learning material
We delivered a series of workshops on tidy transcriptomics, which track the progress of the ecosystem.
How to cite tidy transcriptomics
tidybulk
Mangiola, S., Molania, R., Dong, R. et al. tidybulk: an R tidy framework for modular transcriptomic data analysis. Genome Biol 22, 42 (2021). https://doi.org/10.1186/s13059-020-02233-7
tidyseurat
Stefano Mangiola, Maria A Doyle, Anthony T Papenfuss, Interfacing Seurat with the R tidy universe, Bioinformatics, 2021;, btab404, https://doi.org/10.1093/bioinformatics/btab404
tidySummarizedExperiment and tidySingleCellEXeperiment
You can use tidyseurat citation as introduces the concepts of data abstraction.